State of our Rivulets Report

Hobart is surrounded by natural beauty. The mountain, Kunanyi / Mt Wellington, sits high above us and is slightly removed by its elevation. Its rivulets are braver, plunging down the slope and cutting through Hobart. They bring wildlife and greenery into the urban landscape.
This study uses the presence and diversity of waterbugs to provide a benchmark for the ecological health of Hobart's four major rivulets (from north to south):
- New Town Rivulet
- Hobart Rivulet
- Sandy Bay Rivulet
- Lambert Rivulet.
Waterbugs provide insight into the longer-term effects of water quality on the health of a freshwater ecosystem. Waterbugs break down and feed on organic matter and each other. They are important food for larger animals in the food chain. This includes native freshwater fish and the much-loved platypus, which inhabit Hobart's rivulets.
The diversity of waterbugs at particular points along a waterway can tell us much about that waterway's long-term exposure to impacts such as pollution and sediment. The presence of more sensitive waterbugs indicates lesser impacts. Sites populated only by "tolerant" organisms suggest impacts of pollution, sedimentation and erosion. Tolerant waterbugs are those that have resilience to these impacts.
By measuring the ecological health of Hobart's four main rivulets over time through the presence of waterbug diversity, we can determine which areas most need closer monitoring and remediation.
State of our Rivulets(PDF, 11MB)
New Town Rivulet
Sampling of the New Town Rivulet headwaters (reference site NTR01) revealed very healthy diversity and abundance of sensitive waterbugs. Further downstream, as the rivulet is increasingly impacted by urbanised areas within the catchment, the trend in ecological health declines steadily. By the lowest sample site the rivulet is impacted. There is a marked decline in ecological health between NTR03 and NTR04, then a further drop between NTR06 and NTR07.
Almost one quarter of the waterbug diversity in the rivulet is lost between NTR02 and NTR03. By NTR07 just over half of waterbug types remain.
The tree cover reduces abruptly at NTR03, possibly causing a related spike in algal cover at this site.
Electrical conductivity increases consistently downstream in New Town Rivulet. This is likely to reflect the wide array of soluble pollutants entering the rivulet (Figure 6). In contrast, temperature increases to NTR04, then starts to decrease downstream. This may reflect the canopy cover in the lower sections of the rivulet, which is mostly greater than 50 per cent despite the urban surrounds.
NTR04 is downstream of Girrabong Avenue, a stormwater junction associated with known sewer leaks. NTR03 was chosen to be close but upstream so it is likely that the drop in ecological health observed between these two sites can be attributed to the Girrabong Avenue point source. Electrical conductivity spikes, then remains constant after NTR04 until NTR06, the next known point source for pollution along the rivulet.
NTR06 is downstream of the Pottery Creek junction, a small catchment with multiple known sewer leaks. There is no discernible difference between the ecological health measured at NTR05 (upstream of the confluence with Pottery Creek) and NTR06 (downstream). Electrical conductivity is higher at the lower site, however, and continues to rise downstream.

Click for larger map(JPG, 659KB)
Hobart Rivulet
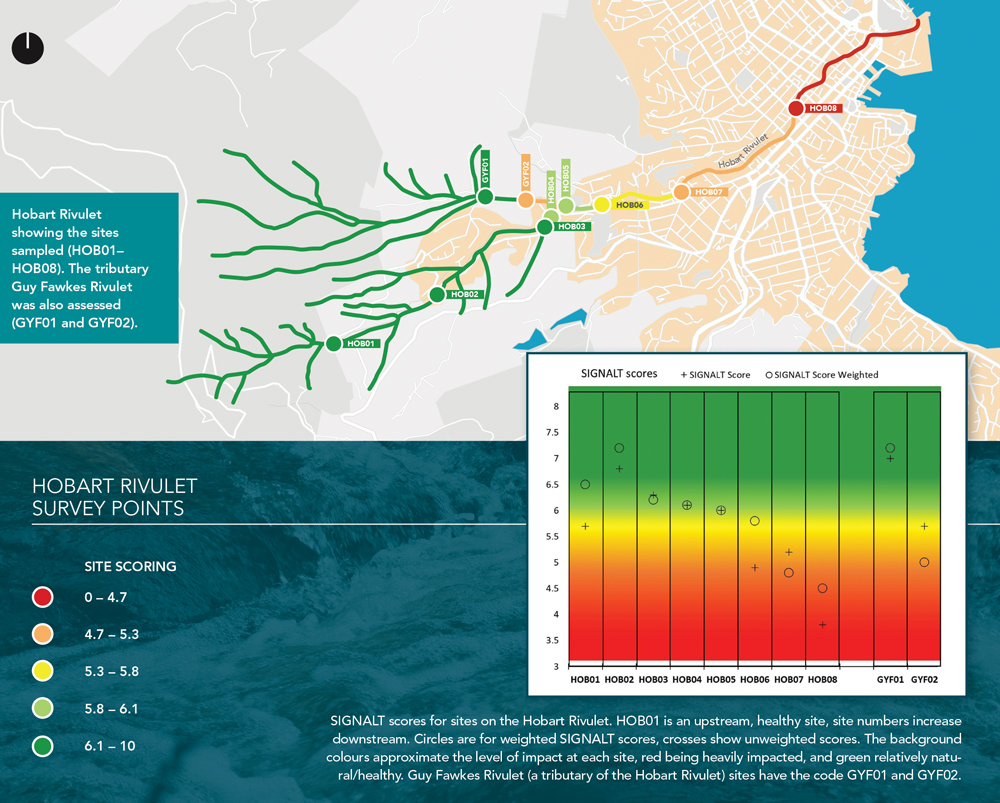
SIGNALT scores decrease downstream along Hobart Rivulet. HOB06 and GYF02 both register as impacted compared to the next site upstream. HOB07 is noticeably more impacted than HOB06 when looking at SIGNALT weighted. Interestingly, unweighted scores are very similar for these two sites, suggesting the difference between them is a drastic change in the abundance of a sensitive animal (such as a mayfly or stonefly).
The two point source impacts identified for this rivulet were immediately upstream of HOB04 and HOB06. Unlike New Town Rivulet, these impacts don't stand out by themselves in the change of Weighted SIGNALT downstream. HOB04 (infrastructure including a sewer junction near Old Farm Road), HOB05, and HOB06 (outflow from the Hobart tip) simply continue the downstream degradation trend. The first step in this trend is between HOB06 and HOB07, and this is likely due to the distance between the two sites being greater than the gaps between sites upstream, thus allowing the trend to be further advanced at the downstream sample site.
GYF02 is noticeably different to the upstream reference site GYF01. This site placement was intended to see if the willow infestation at the lower site would result in a drop in ecological health. These sites are ideal for this comparison – both sites share very similar and low levels of urbanisation and are upstream of most stormwater pollution. The only possible impact other than willows at GYF02 could be leaky septics upstream, but this scenario is just as likely for GYF01 upstream.
The largest change in waterbug diversity is between sites HOB07 and HOB08 compared with New Town Rivulet. The diversity changes very little otherwise, so the drop in ecological health downstream from HOB03 is driven mainly by a change in assemblage. Waterbugs with high SIGNALT grades are replaced by lower scoring ones, but the overall number of different types of waterbug remaining is similar (14–19), right down to HOB07.
The tree canopy cover drops markedly at HOB03 (to 30 per cent) and an algal response can be seen in Figure 10. Lower canopy cover at sites HOB07 and HOB08 don't show the same response in algal cover, but this reduction in algal cover may be due to scouring impacts at lower elevations, where flows are larger.
Electrical conductivity increases downstream, but remains relatively constant between HOB03 and HOB06. This is possibly a reflection of how geographically close these sites are.
Temperature increases downstream from HOB01 to HOB05, then seems to be reset at HOB06. This pattern does not fit with any of the other variables recorded during the survey and remains an interesting anomaly. One piece of information missing that could possibly explain it is diurnal variability in temperature (and all the water quality variables).
Click for larger map(JPG, 599KB)
Sandy Bay Rivulet
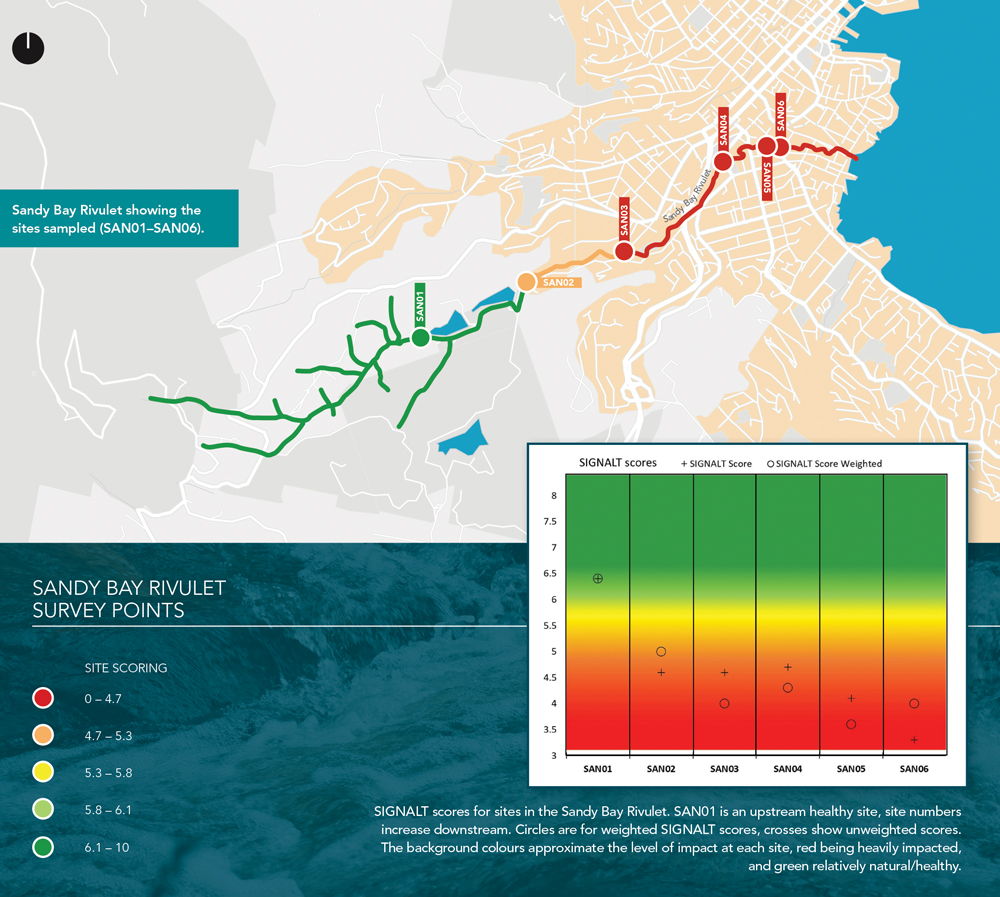
Sandy Bay Rivulet is in good condition upstream of Waterworks Reserve, but drops markedly almost immediately downstream. The ecological health as measured by weighted SIGNALT of the system continues to decline downstream.
The number of waterbug types sampled doesn't drop off to less than 10 until SAN05, the weighted SIGNALT scores drop well before this (SAN02). This pattern reflects changes in assemblage, sensitive animals being swapped for tolerant ones as the sampling moves downstream, while the overall diversity doesn't change much. Until SAN05.
Algal cover increases at SAN03 at the same time as the percentage canopy cover decreases.
Electrical conductivity increases consistently with sampling downstream. The trough at SAN02 might be the discontinuity of the rivulet at this point after passing along the rock channel alongside the reservoir. The temperature shows a similar spike at SAN02, the channel doesn't have tree cover and would likely heat up more than if it was covered with vegetation. SAN03 had high algal cover and an unpleasant smell prompting concerns over the source of nutrient load in this part of the catchment. Further investigation is required to understand why Sandy Bay Rivulet drops so dramatically in health from above the reservoirs to below and beyond, while maintaining a good diversity of waterbugs, albeit the assemblage is dominated by more tolerant macroinvertebrates.
Sandy Bay Rivulet provides an instance where there is an observable drop in SIGNALT around a likely point source that wasn't identified prior to sampling. The low dissolved oxygen and slightly elevated turbidity at this site suggest an impact such as sewer overflow. This would be worth further investigation.
Click for larger map(JPG, 592KB)
Lambert Rivulet
Lambert Rivulet is the smallest of the rivulets sampled. It differs from the other three in having some urbanisation along the entirety of its length. The other three rivulets all contain upstream catchments that are predominantly native bushland. The upstream site in this rivulet (LAM01) starts as impacted, and the two sites downstream are worse but similar to one another.
All the diversity scores in Lambert Rivulet are low (<15 types of waterbug) compared to the upstream sites in other rivulets (SAN01 had 21 different types). Lambert Rivulet has good riparian cover along its length, maintained along with adjacent linear parks. The canopy cover at LAM02 was slightly less than at the other sites and corresponds with a rise in algal cover.

Click for larger map(JPG, 520KB)